detr-geo
Runs RF-DETR over a GeoTIFF and hands the detections back as GeoJSON, GeoPackage or Shapefile, in the image's own coordinate system.
- Status
- shipped
- Tags
- python, object-detection, remote-sensing, pytorch
- Source
- Repository
- Live
- Visit
Scene
Detections
detr-geo came out of a product rather than a paper. At the analytics company I co-founded in 2023 we sold a parking-occupancy measure read from satellite imagery, and the detection pipeline behind it is open source now as this package. RF-DETR expects a photograph, a small 8-bit RGB image with no idea where on Earth it sits. A satellite scene is thousands of pixels across, often 16-bit, sometimes multispectral, and carries a coordinate system without which the detections are just rectangles.
So the scene is cut into tiles, each tile is run, and the boxes are stitched back into the scene’s CRS. A car straddling a tile boundary is found twice, so there is a deduplication pass across tiles. Band presets cover NAIP, Sentinel-2 and WorldView, nodata is handled, and the export writes GeoJSON, GeoPackage or Shapefile that opens directly in QGIS or PostGIS.
The training pipeline splits datasets spatially rather than randomly, so adjacent tiles cannot leak between train and test. The example weights are fine-tuned on xView and detect five classes of overhead vehicle. The code is MIT and on PyPI; xView is CC BY-NC-SA 4.0, worth knowing before those weights go near a product.
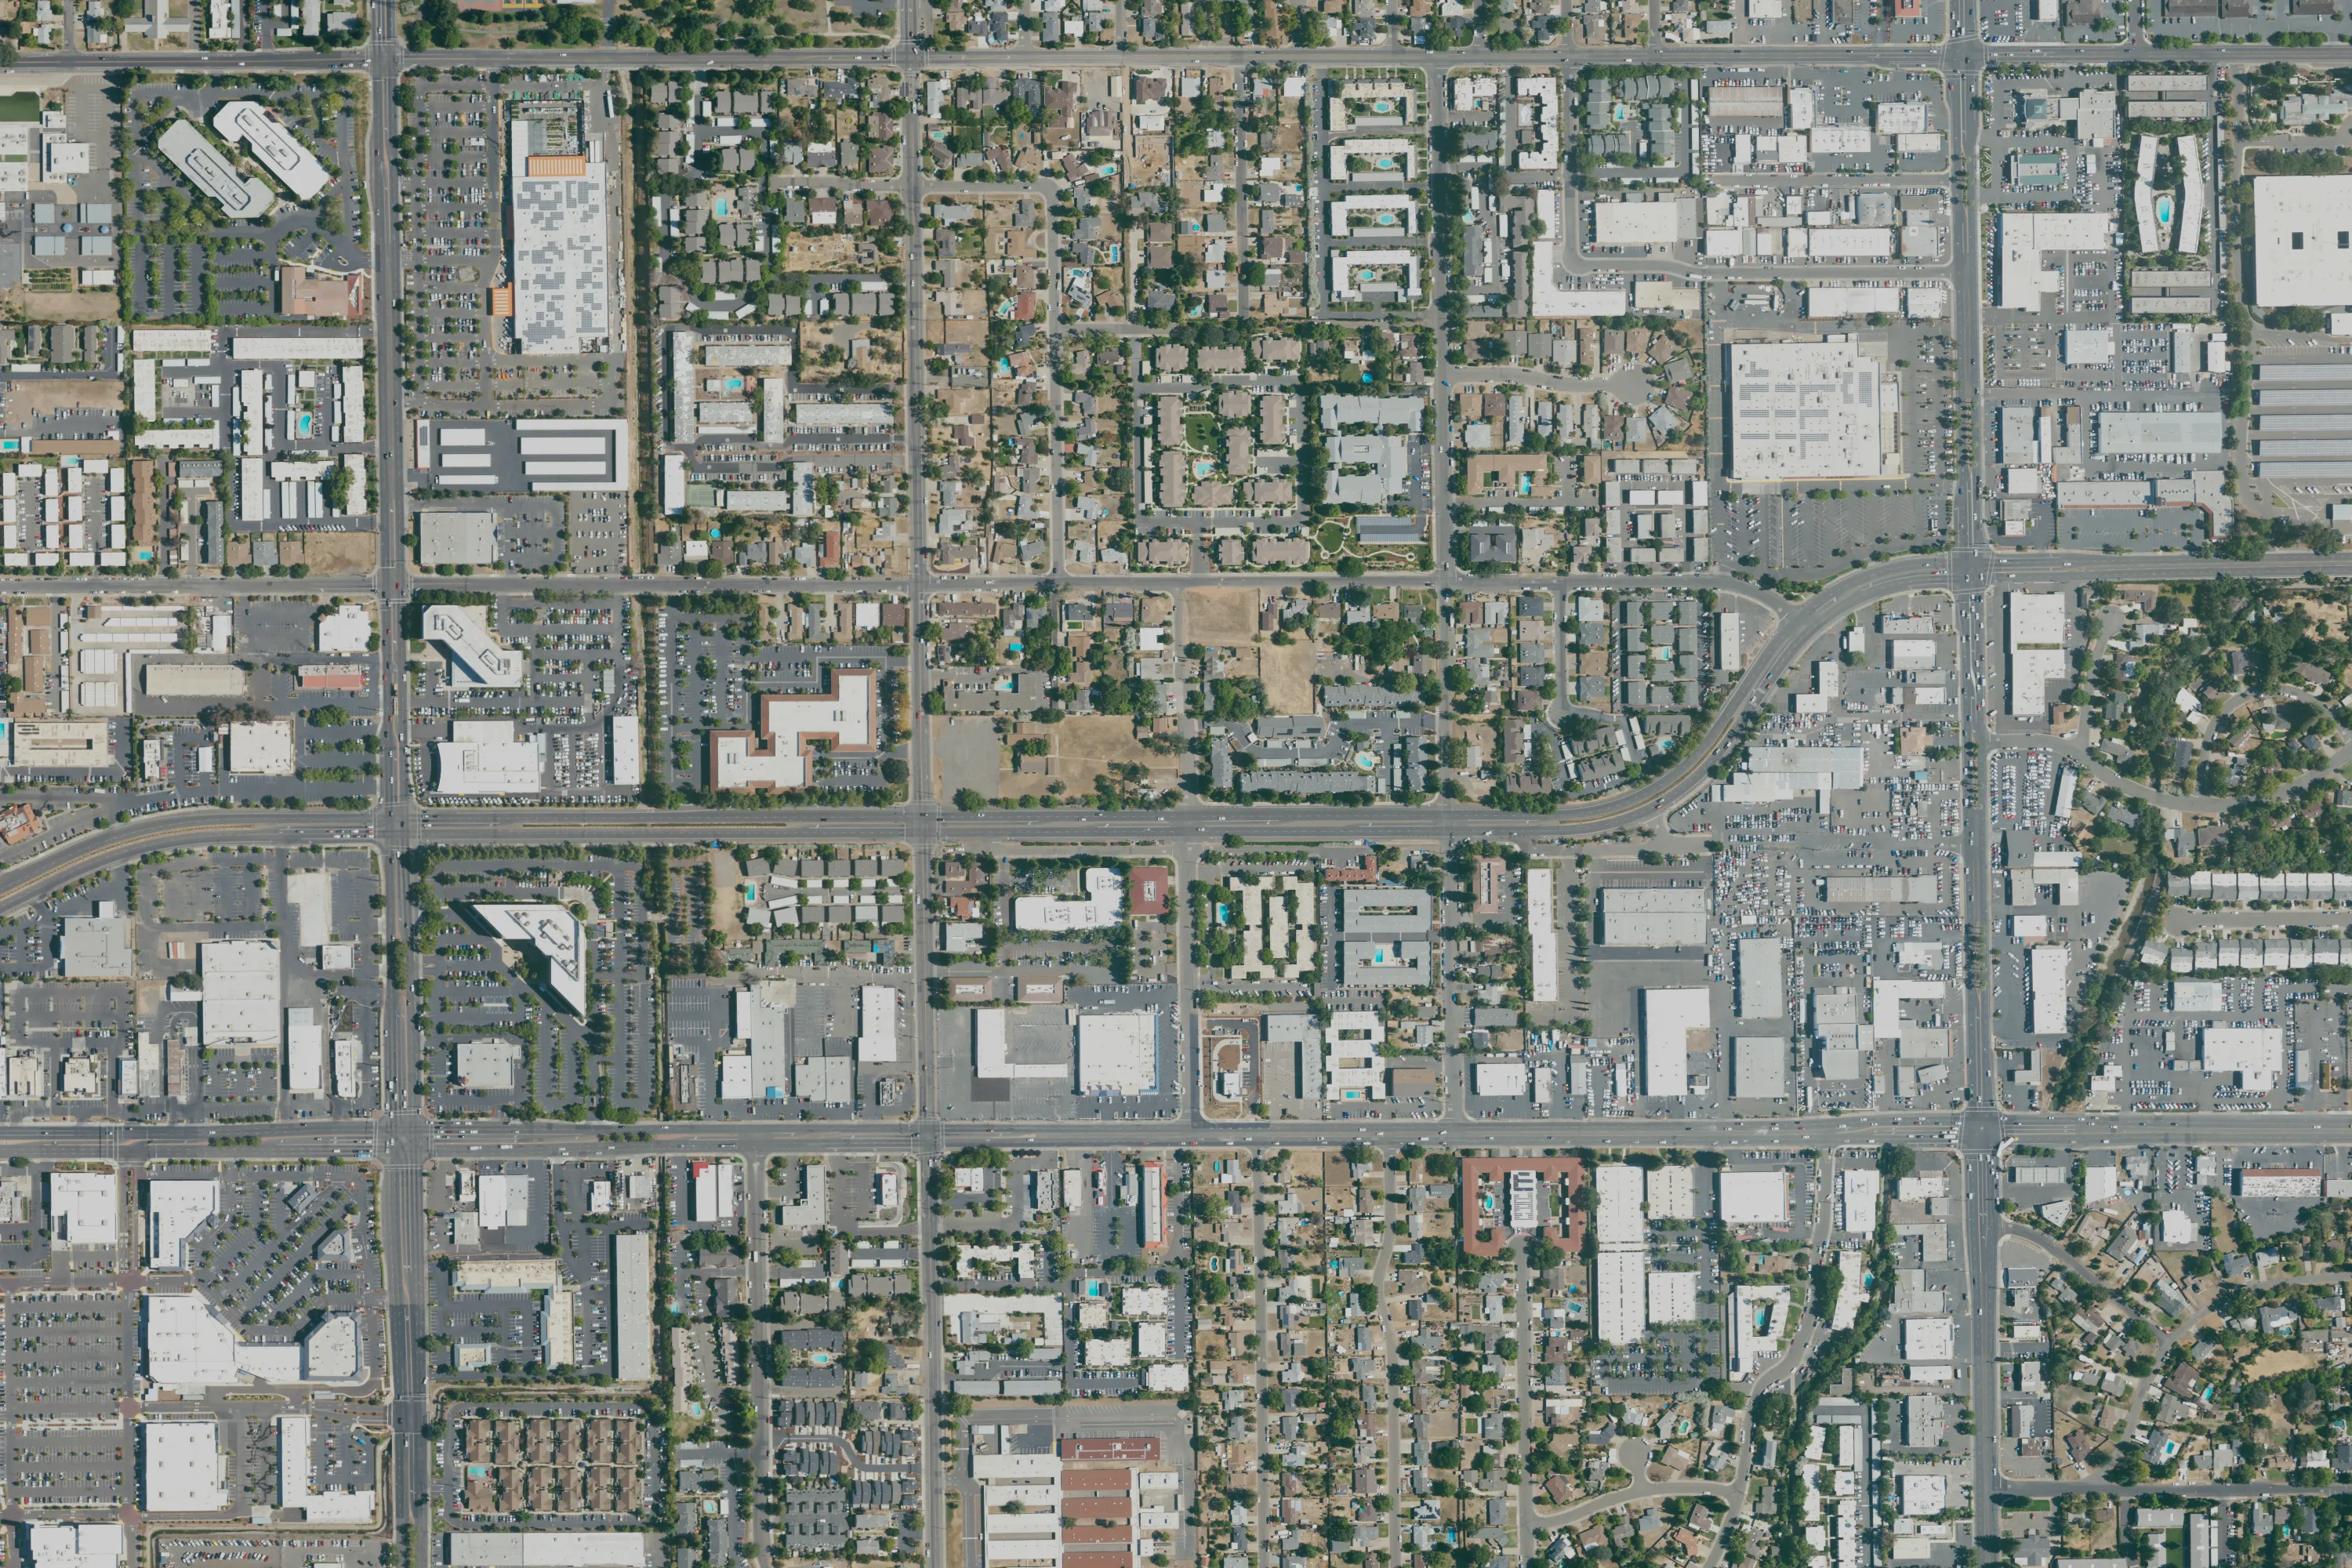
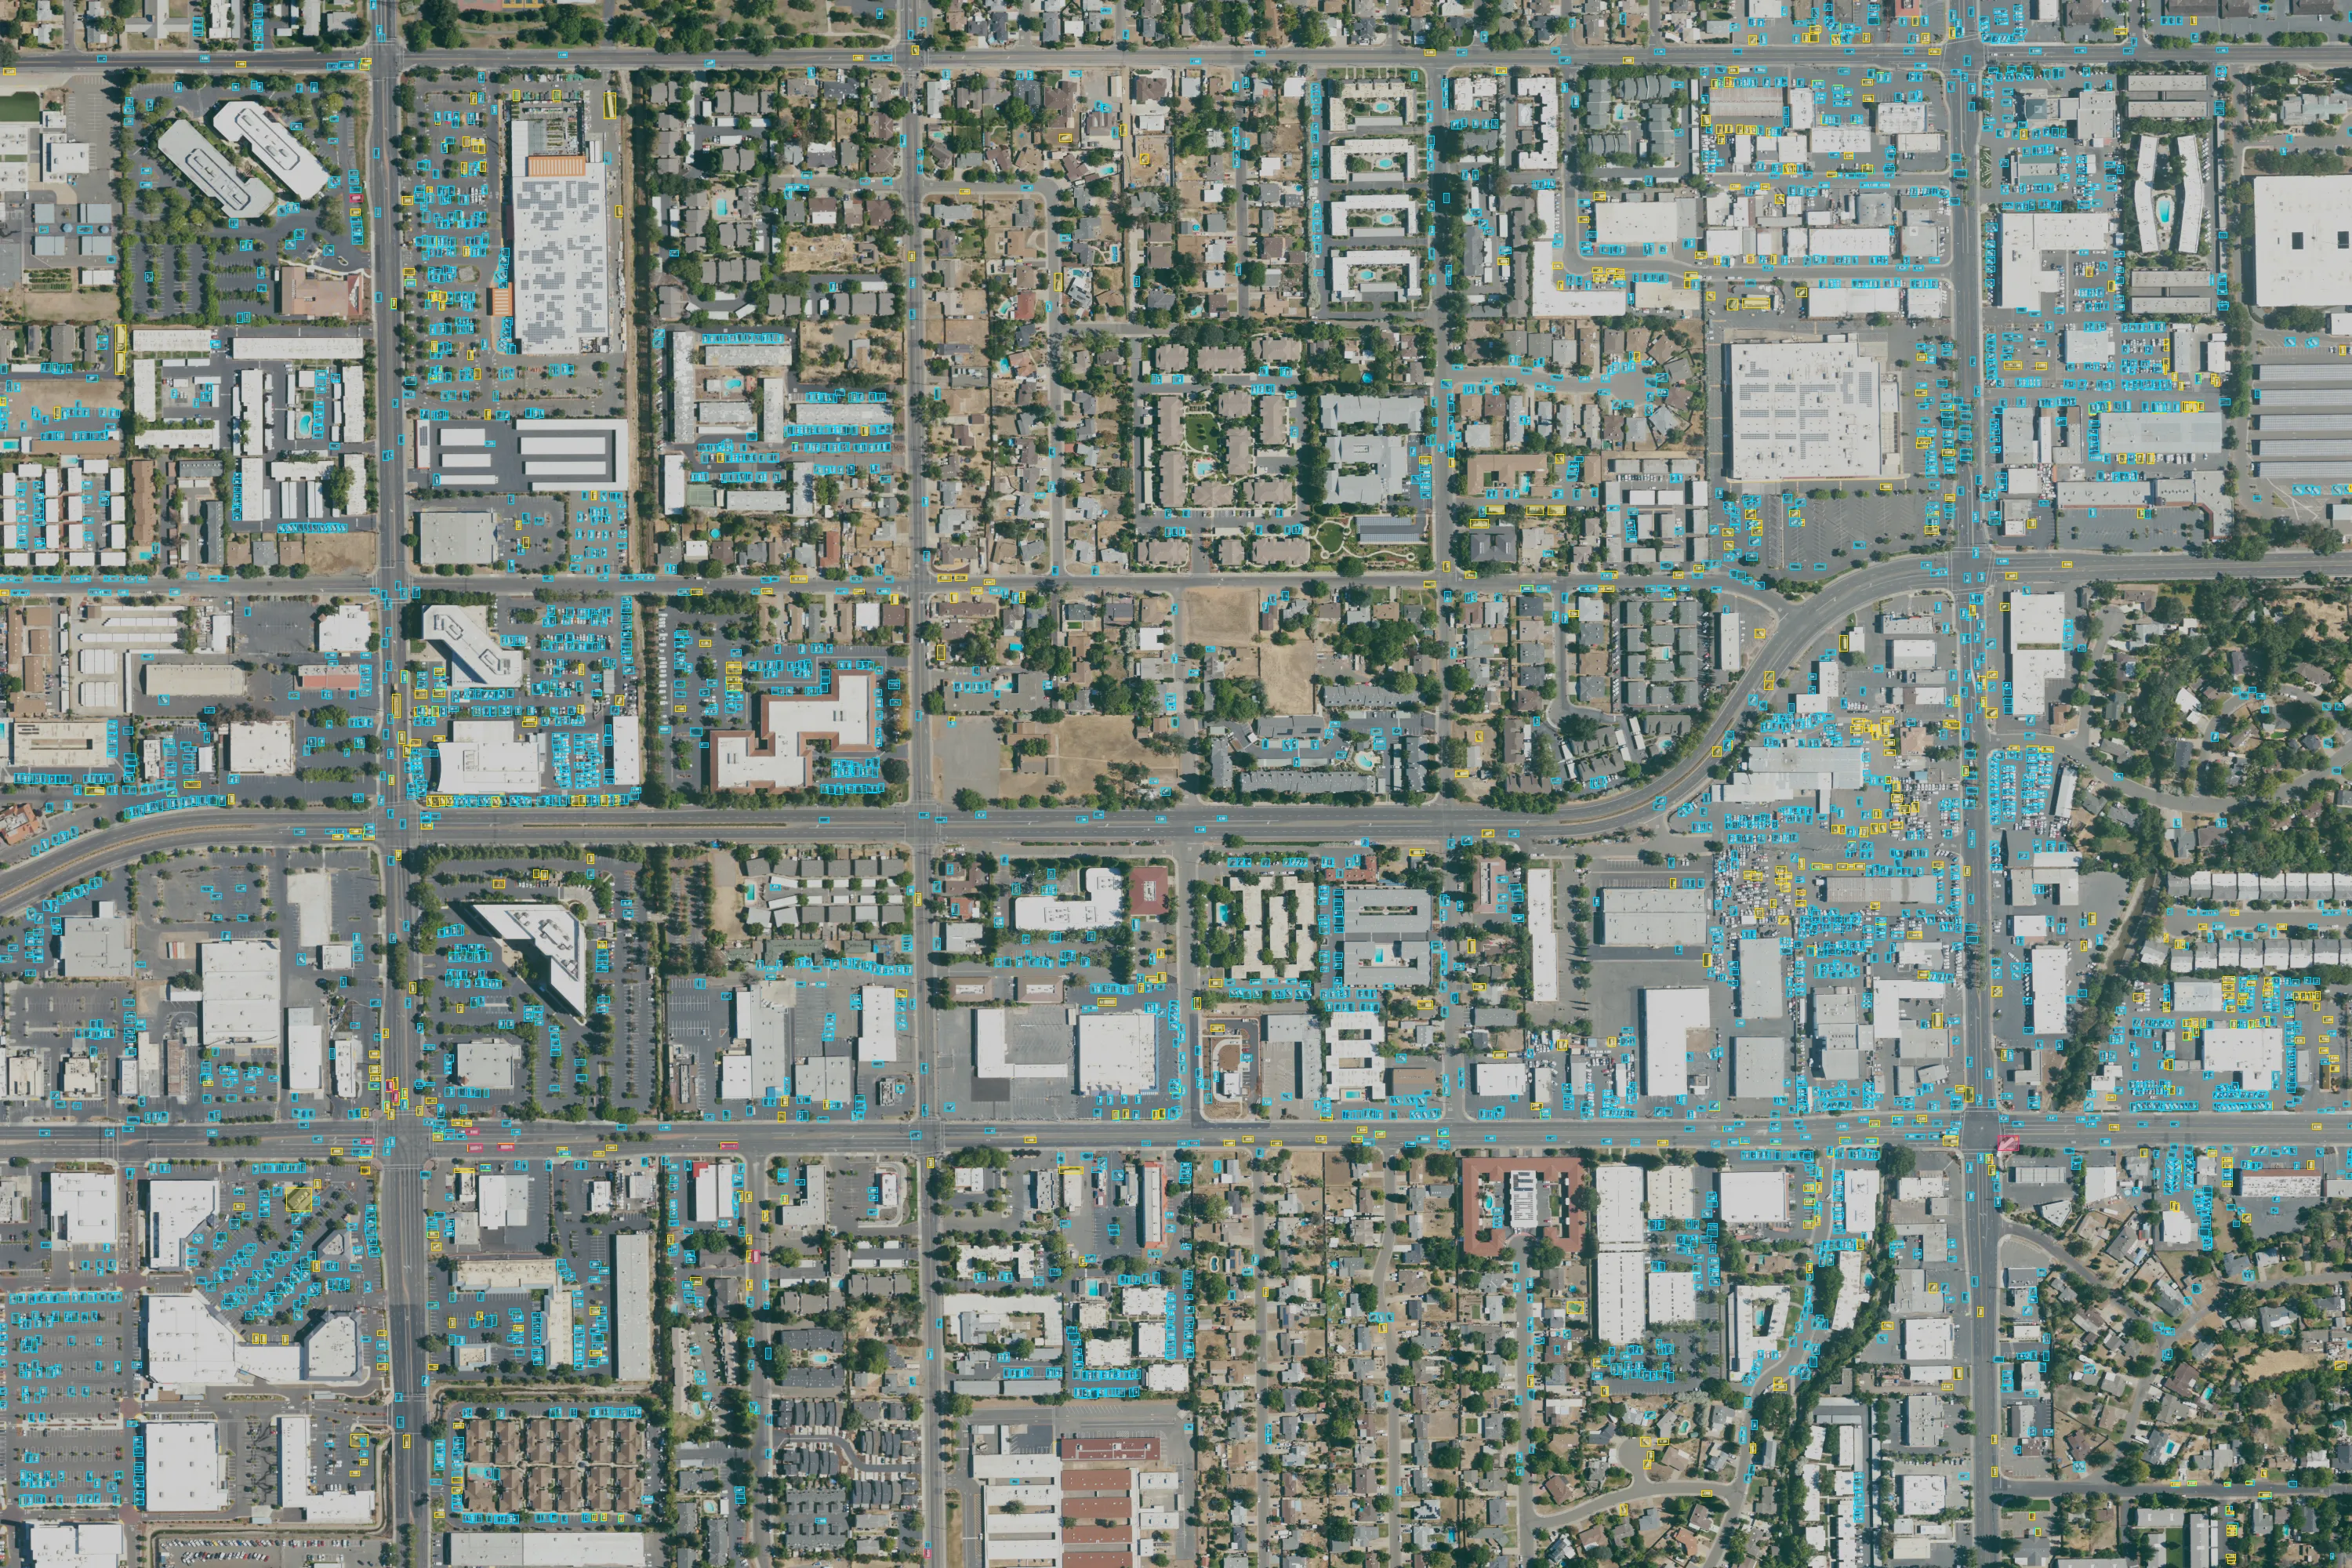
The figure is a NAIP tile of Sacramento from June 2022, run at a confidence threshold of 0.25 and left unfiltered. Cyan is car, yellow is truck, red is bus, and a few boxes sit on rooftop equipment. I left those in. It is not an accuracy figure.
All projects