FirstLight
Turns a plain-language description of an event into a structured query, finds the satellite imagery, picks a detection algorithm to suit what it found, and writes the report.
- Status
- archived
- Tags
- python, geospatial, stac, disaster-response
- Source
- Repository
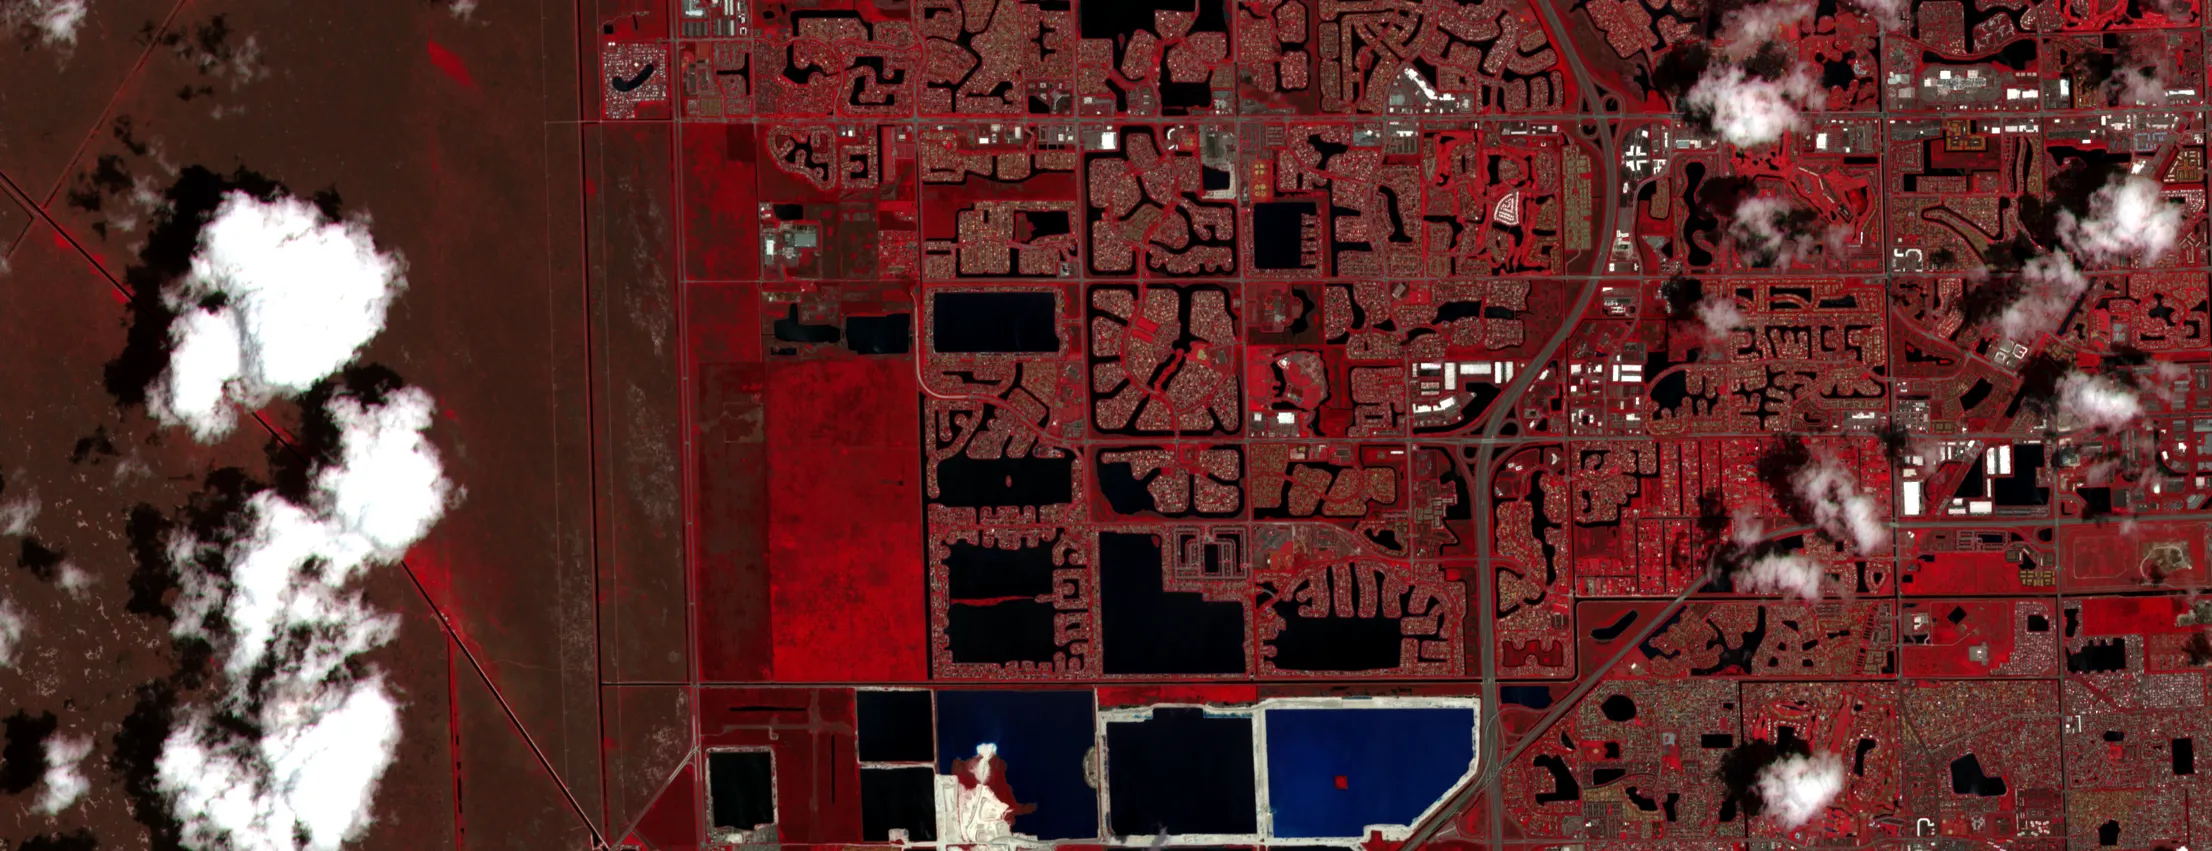
4 April 2026
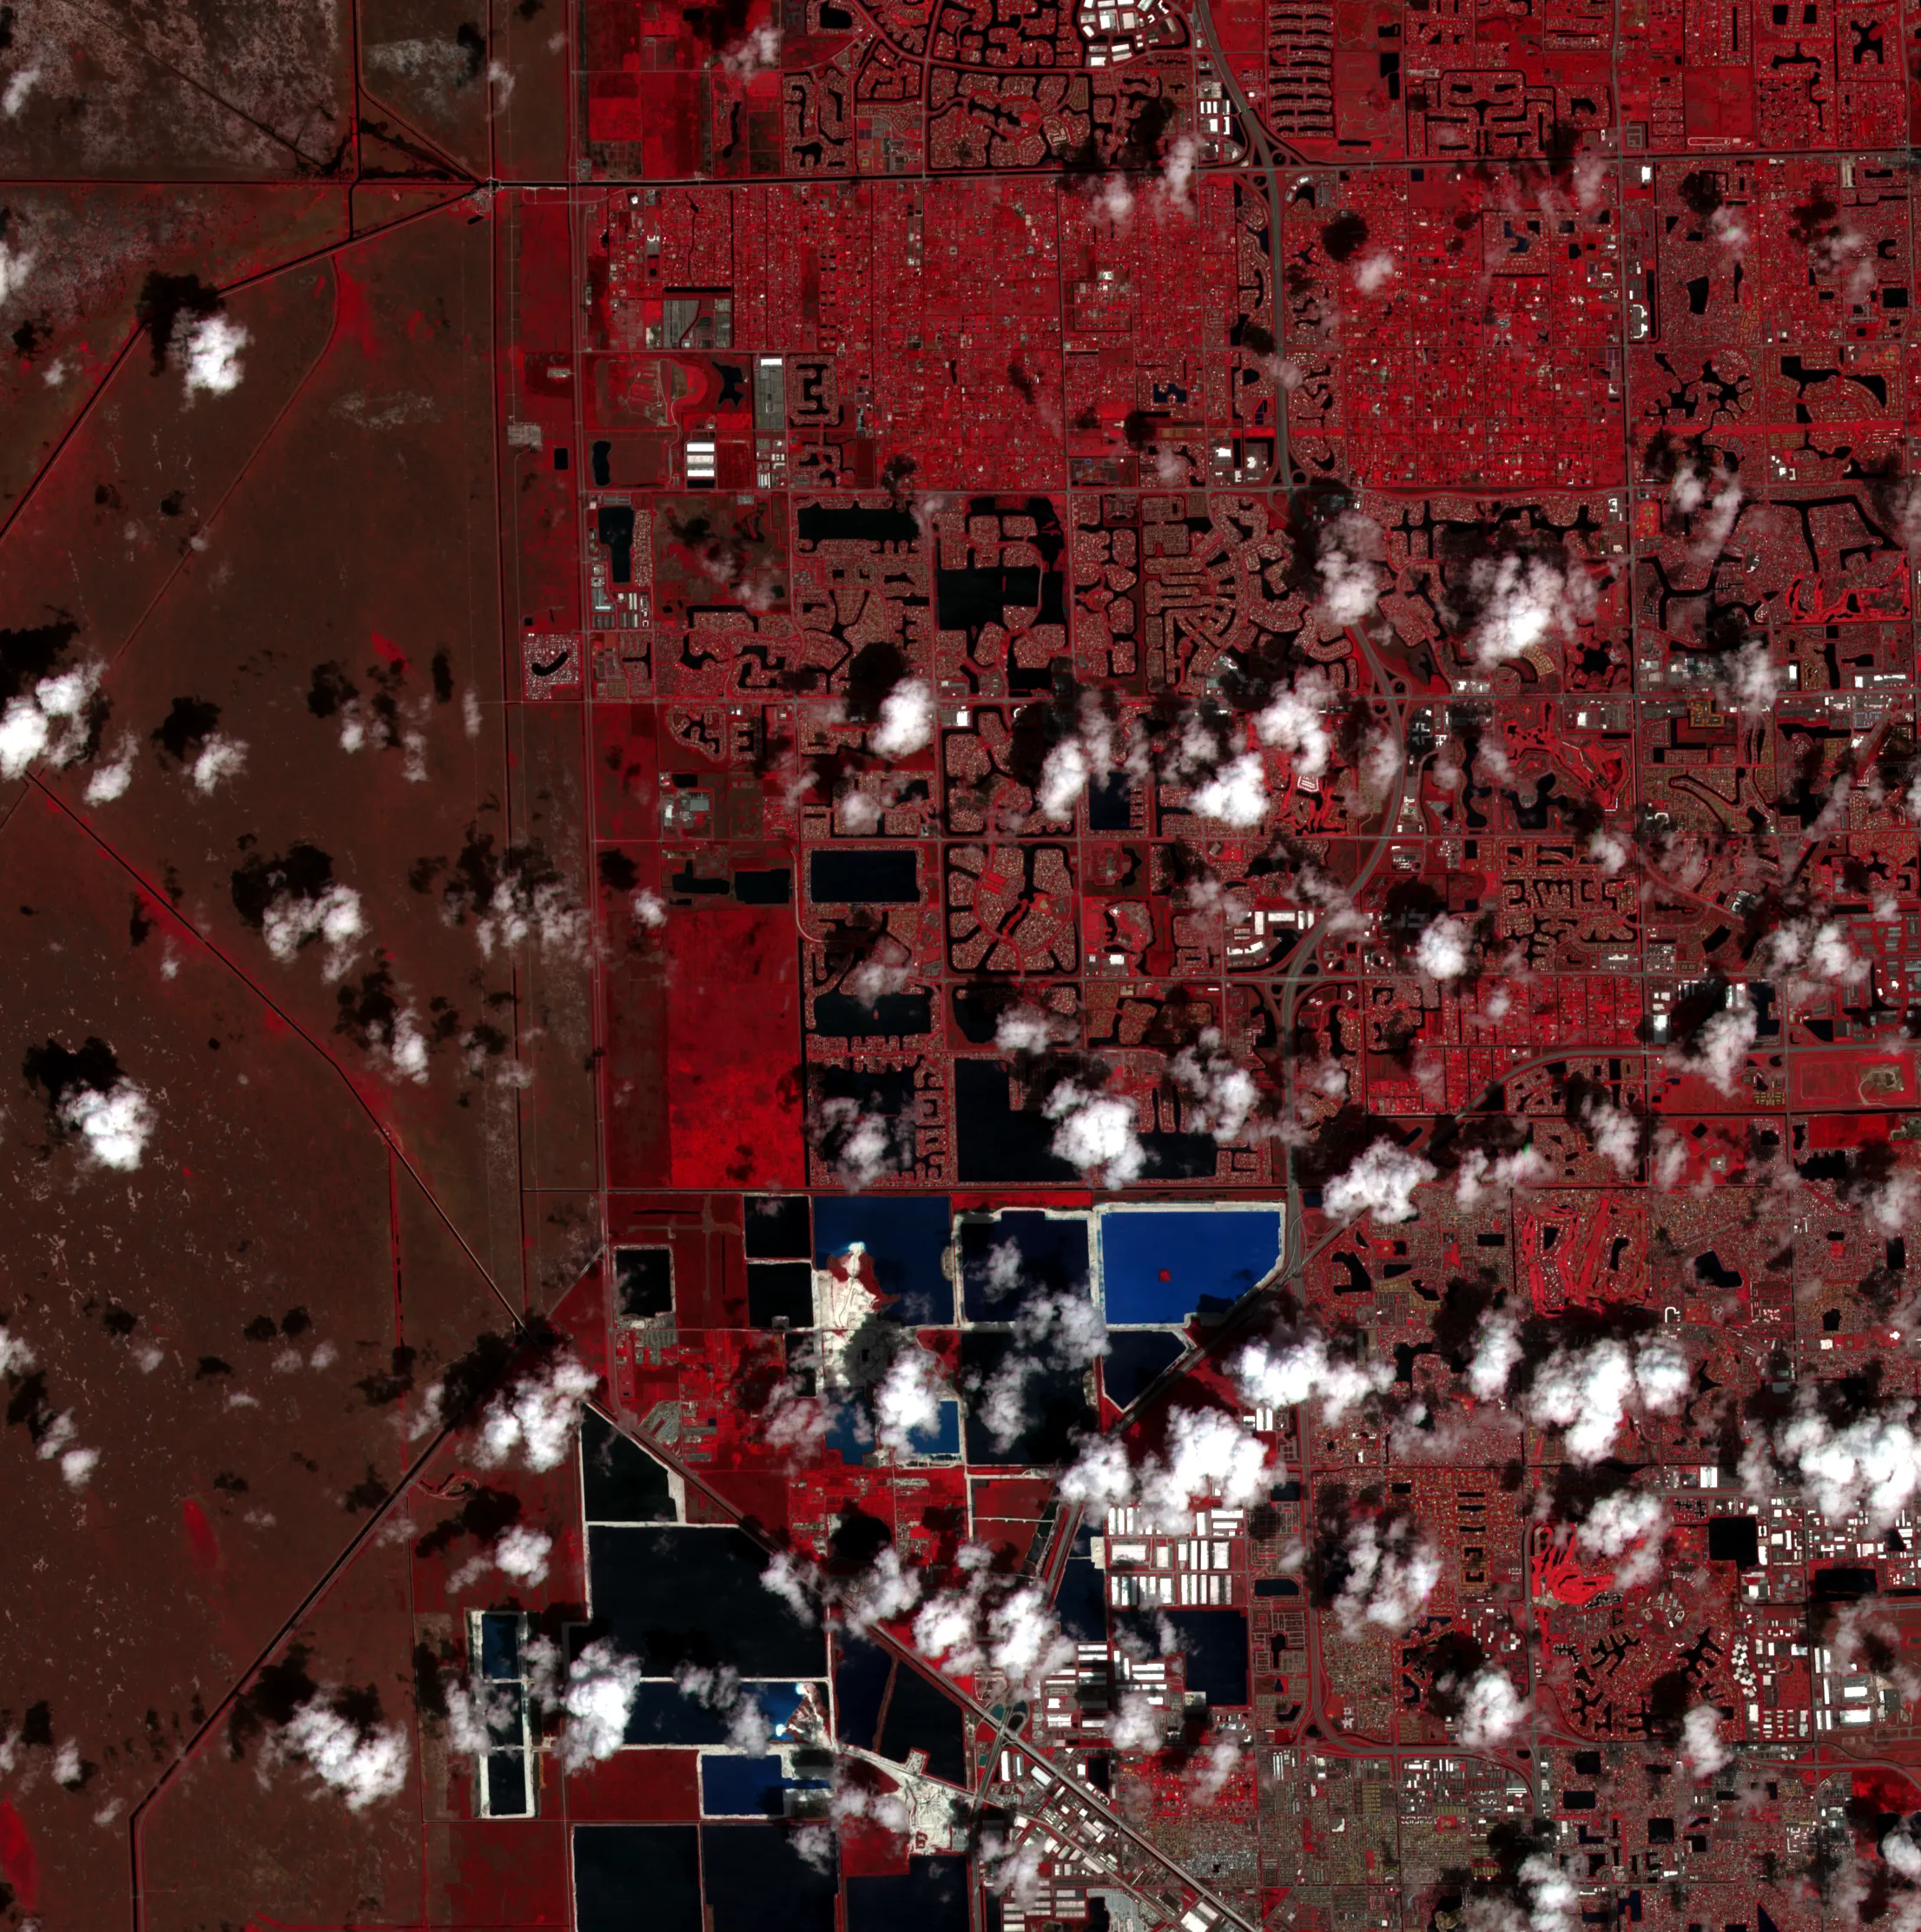
9 May 2026
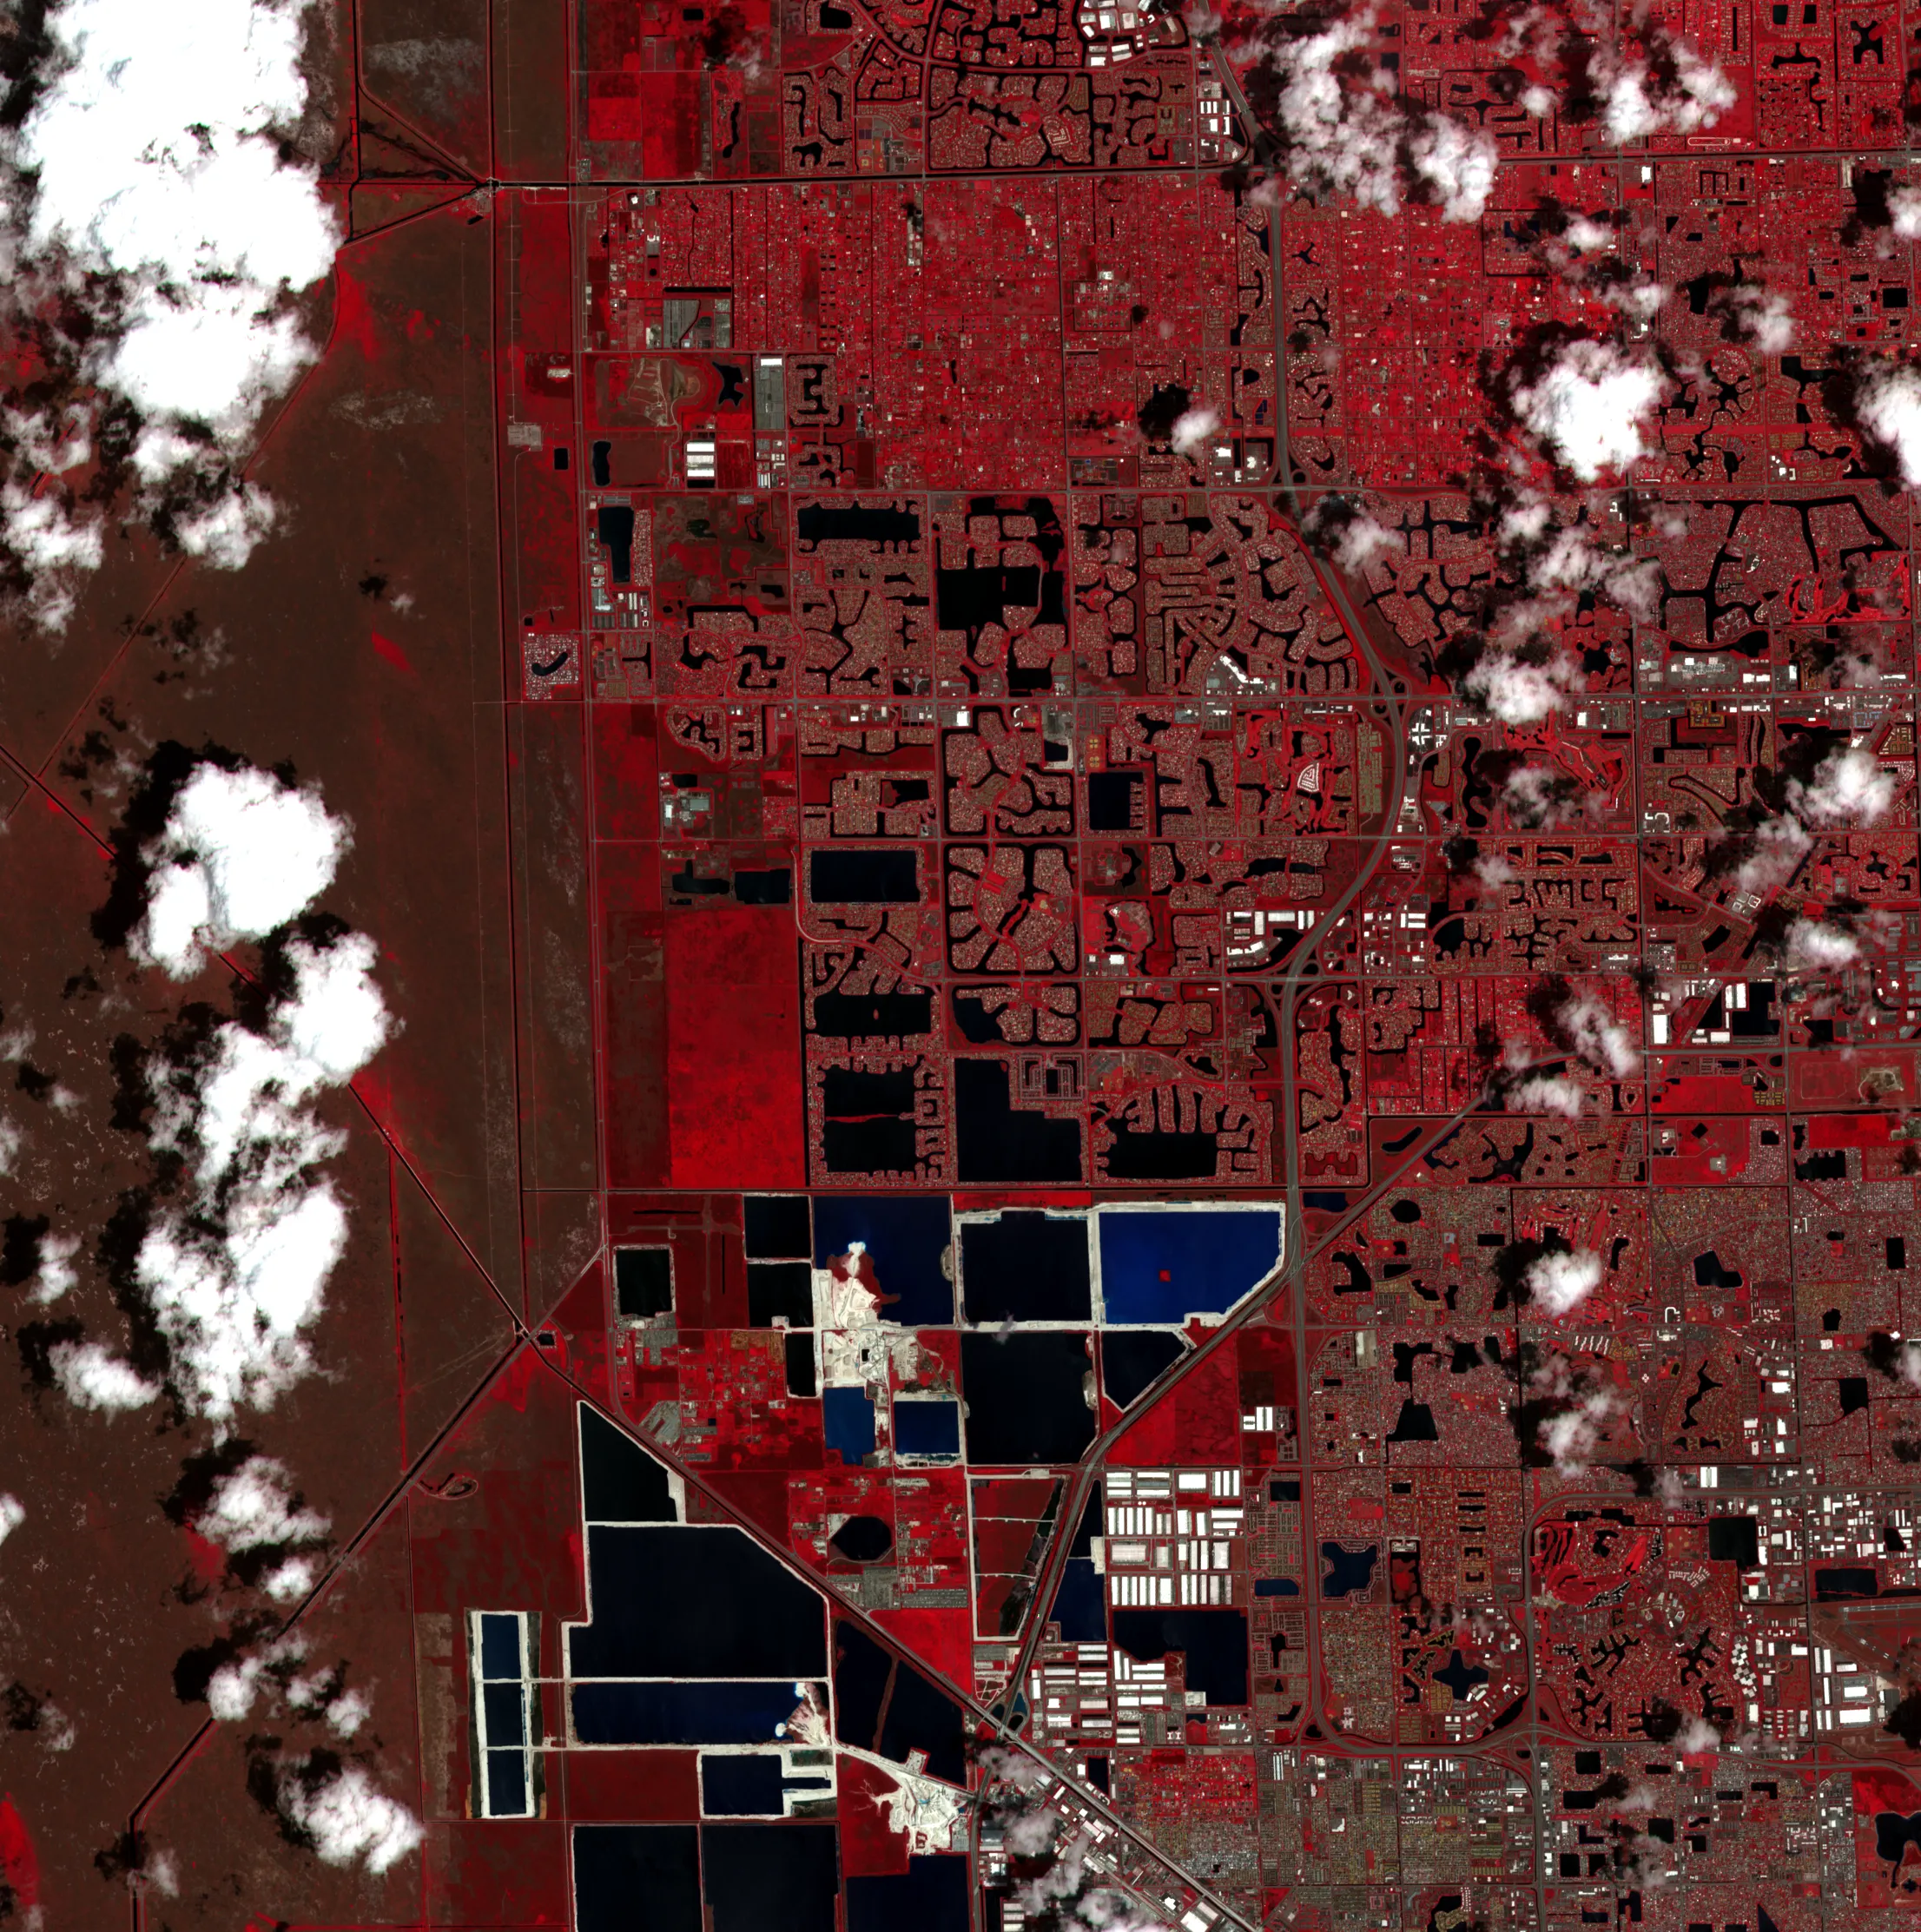
The idea was a sentence in and a report out. You type “flooding in coastal Miami after Hurricane Milton” and FirstLight resolves it into a structured event type and a query, searches STAC catalogues for scenes that cover the place and the dates, and sees what it has to work with. The scene you want is rarely the scene you get, and if the optical pass is under cloud the usable data may be Sentinel-1 radar instead, so the detection algorithms are chosen after the search rather than fixed up front.
It then runs quality control and writes an HTML or PDF report with GeoTIFF and GeoJSON layers alongside. It reads Sentinel-1 SAR, Sentinel-2, Landsat, the Copernicus DEM and reanalysis weather, and picks serial, Dask or Spark execution to suit the machine.
Here is the part I want to be plain about. The worked examples in the repository are rendered from synthetic inputs. The real-imagery path is wired, and the figure above is as far as it has been exercised: two Sentinel-2 scenes of tile 17RNJ over western Broward County, Florida, from 4 April and 9 May 2026, fetched and composited by FirstLight. That is surface reflectance as the satellite delivers it, not an analysis product, and the pipeline has never been validated end to end against a documented event.
I’ve archived it rather than leave it looking finished. What it never got was a run against a real flood with a footprint to score against. The nearest it came is the Broward composite, which FirstLight found and stretched on its own, and which says nothing about a flood.
All projects