FireSpec
Hyperspectral burn-severity and fuel-condition mapping of the January 2025 Los Angeles fires, from Planet Tanager-1 imagery.
- Status
- shipped
- Tags
- hyperspectral, wildfire, remote-sensing, python
- Source
- Repository
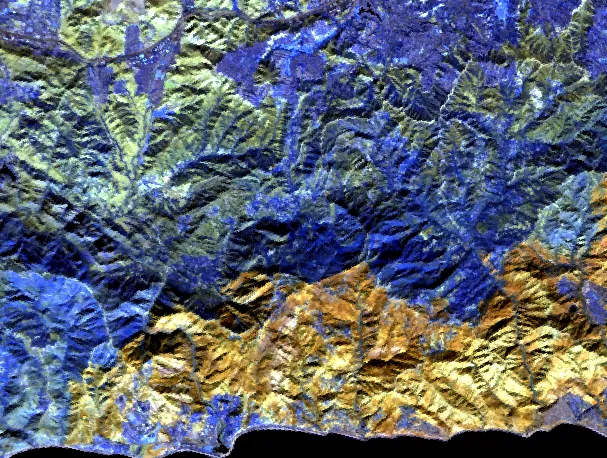
Planet’s Tanager-1 records 426 bands from about 380 to 2,500 nm for every 30 m pixel; Sentinel-2 records 13. FireSpec, built for the Planet Tanager Open Data Competition, is where I found out what the extra bands buy you on a burned hillside. It works the January 2025 Palisades and Hughes fires from four scenes between 15 December 2024 and 7 April 2025.
The main method is MESMA spectral unmixing, which solves a pixel’s blended spectrum for its proportions of char, green vegetation, dry vegetation and soil. My first pass built the reference spectra from the scene itself, so char was defined as the pixels that already looked burned and the map just handed that threshold back. I threw it out and rebuilt the library from 23 USGS Spectral Library spectra measured years before the fire. Inside the Palisades perimeter the median pixel is 38.9% char; outside every known perimeter it is zero. dNBR is still the better burn detector, 0.970 against 0.795, but a library with no knowledge of this fire found it anyway, along with the Franklin Fire and the Kenneth Fire, which I had been treating as unburned ground.
The rest is mostly what the data couldn’t tell me. Against CAL FIRE’s structure inspections the char map does barely better than a coin flip, because a burned house is ash and slab in a 30 m pixel, not blackened chaparral. The moisture product is a relative canopy-water index, not a percentage, because the field network for calibrating one comes to about one site per scene. The severity scores are against a soil burn severity raster whose origin I can’t fully trace, so they are marked provisional.
The repository had 1,120 passing tests and three figures were wrong anyway. About 62% of my dNBR hero image was Pacific Ocean coloured as moderate burn. One query against the NIFC perimeter database caught what the tests had missed.